This short walk-through covers each of the features and controls of the Online Range Viewer.
Watch the short video tutorial on how to use the viewer and get the most out of your poker training and hand analysis sessions.
If you’d like to click along, sign up at rangeconverter.com and get access to the free viewer demo.
Ready? Let’s begin!
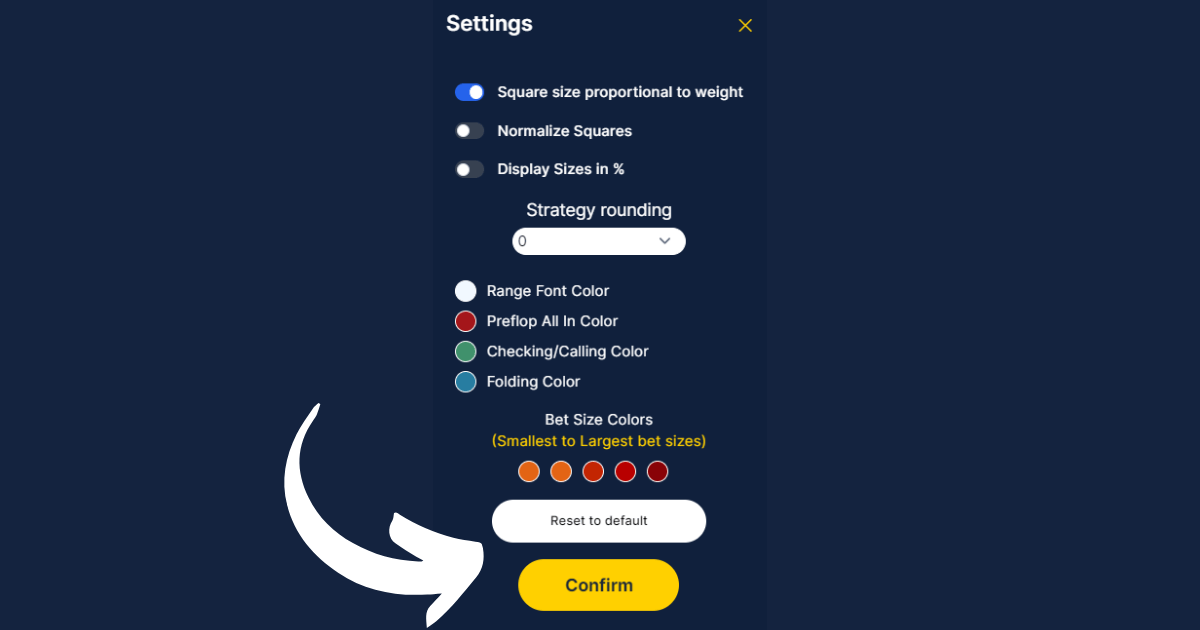
Display Settings Use the settings panel to customize the range viewer interface according to your preferences.
Click the settings icon You can use the following adjustments:
- make the square size in the strategy chart proportional to the weight of the combo in the range normalize the squares
- display bet sizes in % percent of the pot or in big blinds
- strategy rounding - round the displayed strategy to the nearest 10%, 25%, 50% or 100% (pure strategy). This is useful when studying to memorize a strategy with a lot of mixing
- customize all the colors used in the range viewer: check/call and betting actions colors, bet sizes as well as the range text displayed in the charts.
Confirm to save before closing the settings pop up window
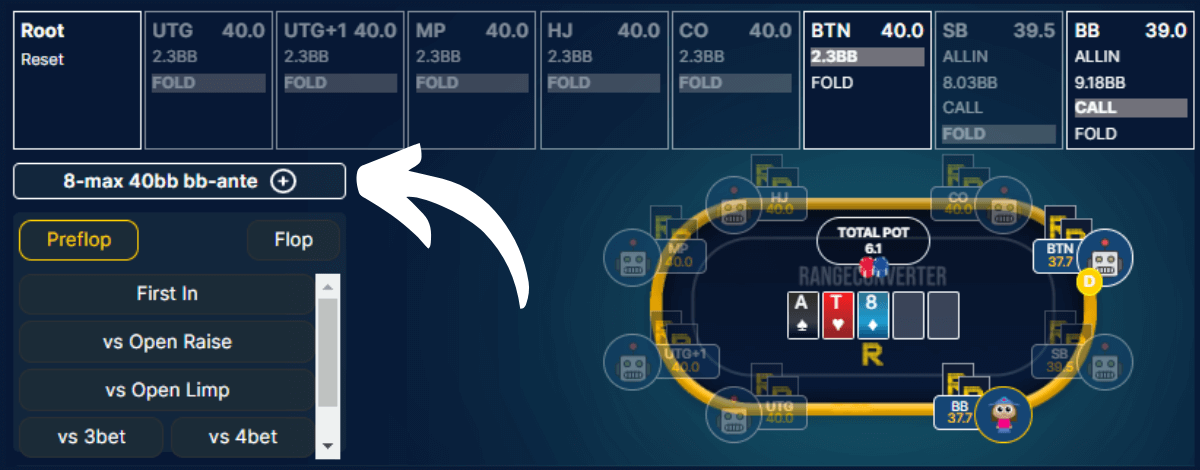
Current sim and sim select
On the left side, just below the game tree navigation bar, you will see the name of the solution that you are currently viewing. Click the + symbol to load another GTO solution from the same sim group, e.g. another stack depth from the 8max MTT or 6max 500z solutions set.
Switch between GTO preflop solutions belonging to the same group
Click on any action in any node of the tree to view the strategy for the next player. Click on any of the nodes and move between decision points to revisit strategy without losing your place in the game tree.
Game tree navigation bar
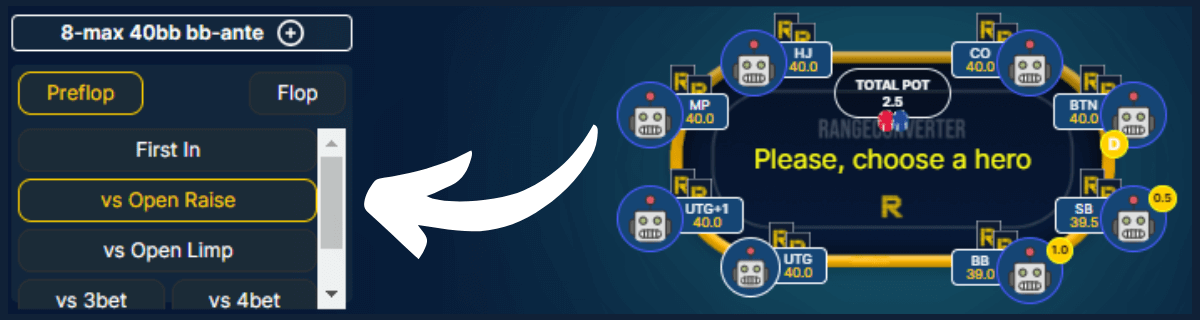
If you want to look up the opening preflop ranges, you can choose the RFI player by clicking any seat at the table or by clicking the strategy bars (all player strategy graph) visible below the table.
You can also use the preflop quick select menu to navigate to common preflop spots. Select the spot type, hero and villain positions to load the strategy charts and preflop ranges of the active players in the hand. Preflop quick select tab
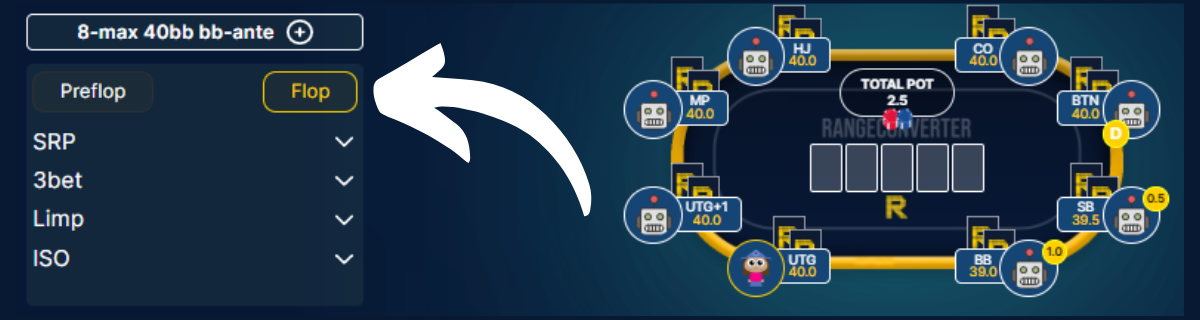
Postflop quick select (Range Pro only)
Use the Flop tab to navigate to common postflop spots from the flop onwards. Select the spot type, e.g. SRP, 3bet, limp or iso, and then the specific spot from the list. Next, choose a flop to view the postflop strategy and navigate further through the hand.
Postflop quick select tab
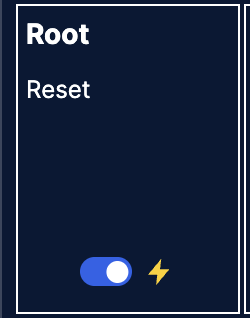
⚡️Fast Nav (available on PC)
.
Reach any postflop spot in seconds. Move from preflop to river with just one strategy load at the end. Not one per action down the tree.
• Toggle on/off via the lightning bolt ⚡️ on the Root breadcrumb (yellow = on). • Hover any action in the breadcrumb to preview the next decision. • Click to commit the line and load the strategy.
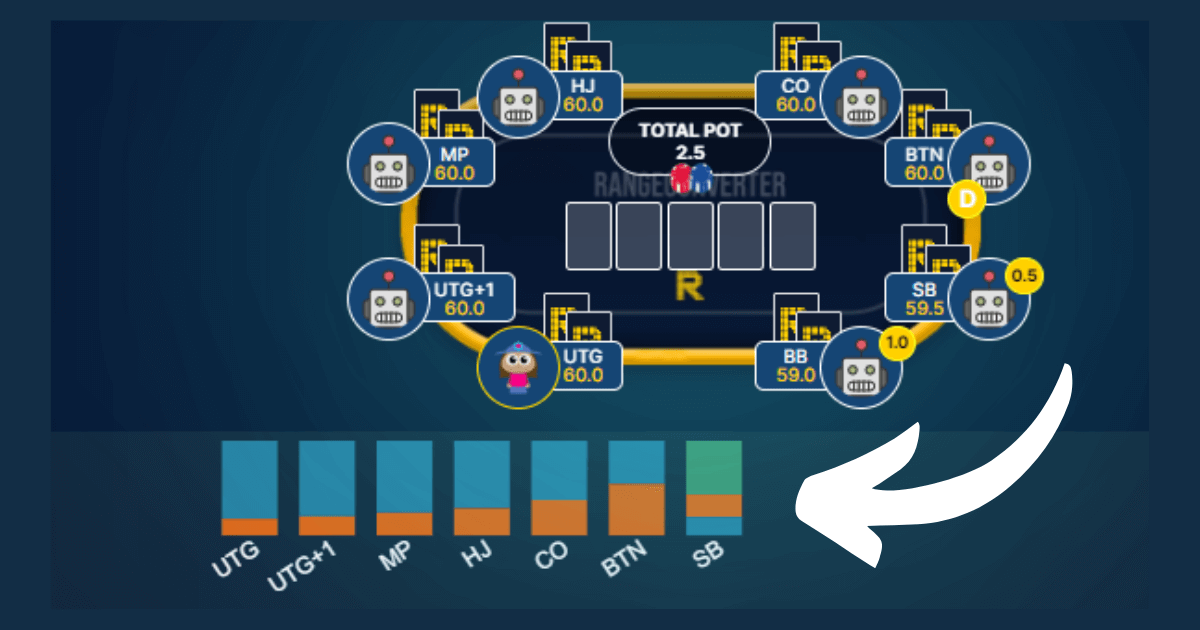
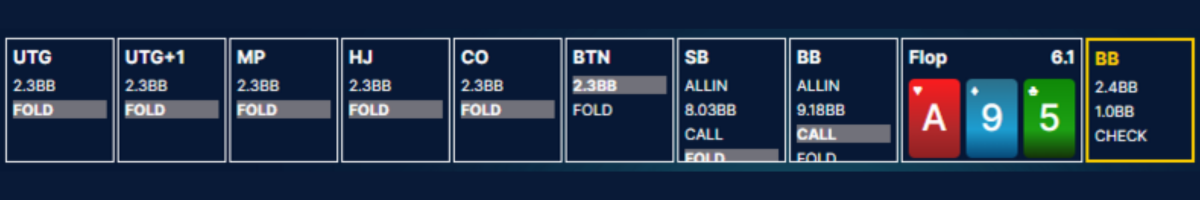
The all player strategy histogram is a concise overview of the all players strategy charts in any preflop spot. It shows the actions frequencies of every player left to act. For example, you can see all players' raise first in strategies at once and when you hover over a bar, you’ll see the exact frequencies of the strategy for a given player.
Clicking on a bar will take you to that spot in the game tree
Strategy view and macro reports
Strategy view
The Strategy tab is the default view. It shows where you are in the tree and lets you see an overview of the active player’s strategy in the current game tree node.
The Strategy tab lets you quickly see an active player’s strategy
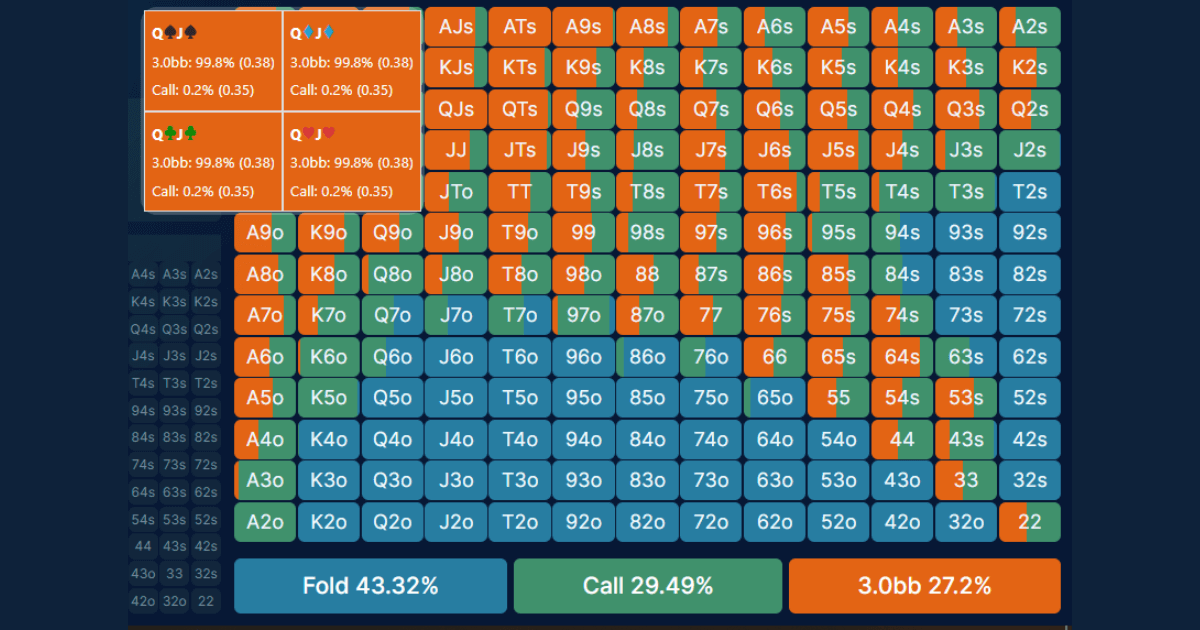
Below it is the GTO poker strategy chart for the active player in the hand at that point in the game tree. You can highlight the poker hand combos of each action by clicking the frequency buttons below the chart.
Combo view
By looking at the strategy chart you can find out which poker hands to play and which to fold. Hover over any combo in the grid to see its breakdown: the actions, frequency and EV for every possible hand combo.
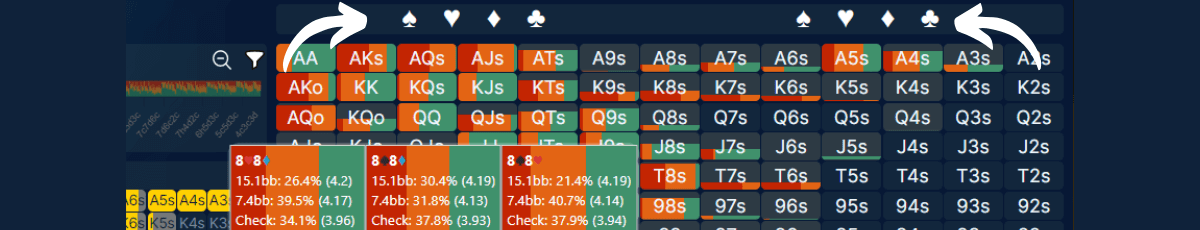
Hover over any combo in the grid to see its breakdown Additionally, while browsing postflop you can filter the strategy chart display to show the strategy only for the specific hand combos, depending on the suits they contain.
Filter the strategy chart by suit
Click on one or more suits from the selection on the left to only show combos where the high card contains that suit. The suits from the selection on the right will filter the low cards in the combos. Filtering for certain hand combos also updates the action frequencies displayed, so you can see the overall strategic frequencies taken by the filtered combos.
All players
All players tab allows you to view every active player's strategy for a specific spot at the same time. Click the All players tab to see what each player in the hand should do. By seeing it all in one place you can learn how the poker strategy changes with position at the poker table. See how to look up poker ranges for all players and across different stack sizes.
All Players and All Stack tabs
All stacks All stacks tab shows you what your strategy should be at every stack size when facing your poker opponents’ actions. With this feature you can easily learn how stack size changes poker strategy. You can see it all in one place and in one click.
Strategy react
Strategy react feature
Strategy react feature allows you to see how certain hand combos react to your opponent’s actions. It is available for both preflop and postflop. Choose a player and action you are interested in and then hover over the strategy charts to look up the reaction frequencies. Default view shows the strategy-react for all hero actions at once, but you can select a specific hero action and villain bet or raise size to see the strategy-react for that line only. This is particularly useful when there are multiple bet sizes available. This way you can simplify the display and see how the reaction changes vs a small bet, a large bet, or vs an all in, for example.
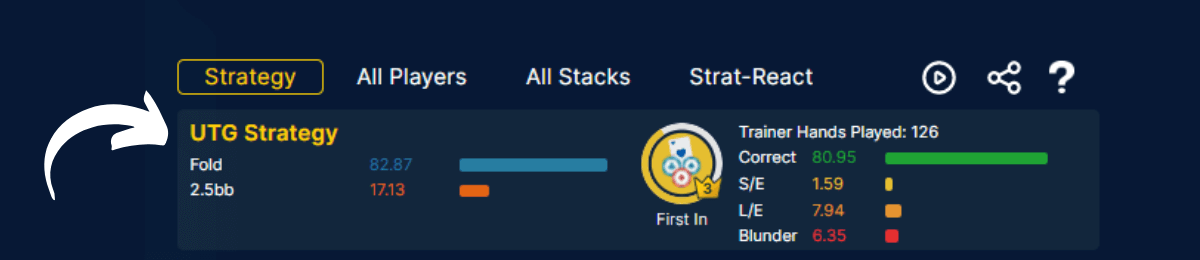
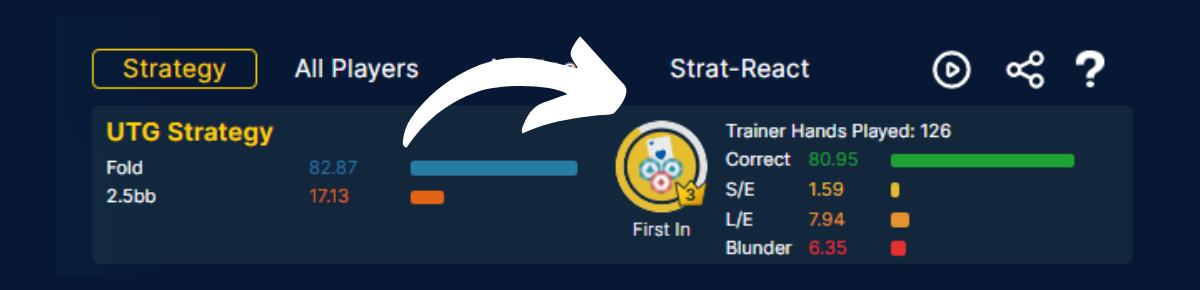
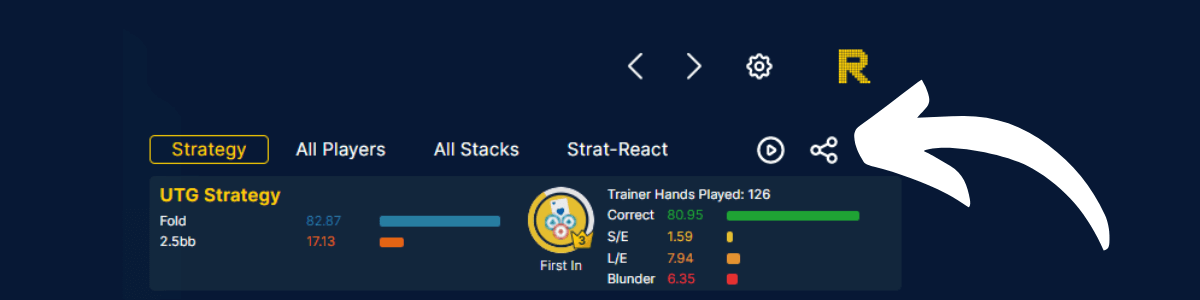
See your training performance directly in the range viewer See your GTO training performance for the corresponding spot and specific poker skill. This feature helps you identify potential weak areas in your game, improve your poker skills and track your progress as you study.
Click on the badge to train that key poker skill course or specific node (in case no course exists for that spot). Find out how to improve your poker skills by using Range Converter GTO Poker Trainer.
Practice the spot you are analyzing
All the Online Range Viewer sims are integrated with GTO Poker Trainer. The Play button will seamlessly switch you to the GTO Poker Trainer in the spot you are viewing, facing the decision of the active player. You can use the online range viewer to set up any custom drill. Just navigate to a spot in the viewer and then press Play to practice it in the GTO trainer. You can also set custom drills in the GTO Poker Trainer.
Share the poker hands you are analyzingYou can share the spots you are analyzing with your friends, your poker coach or a team. To do that just press the share icon located above the main strategy chart. Share the hands you are analyzing
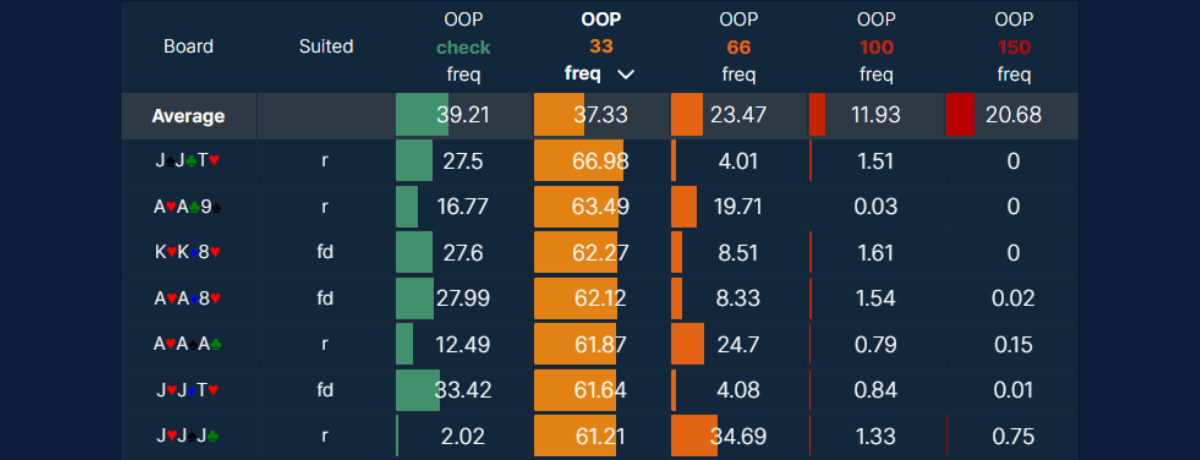
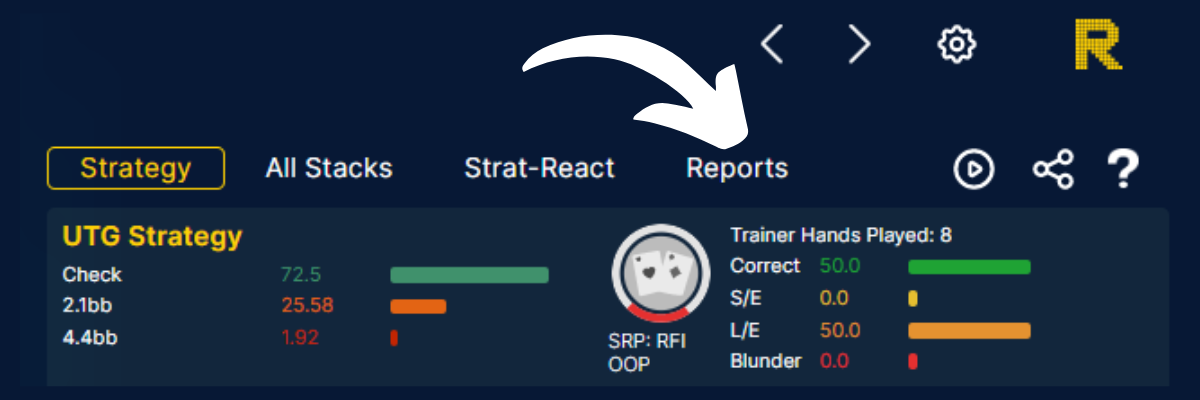
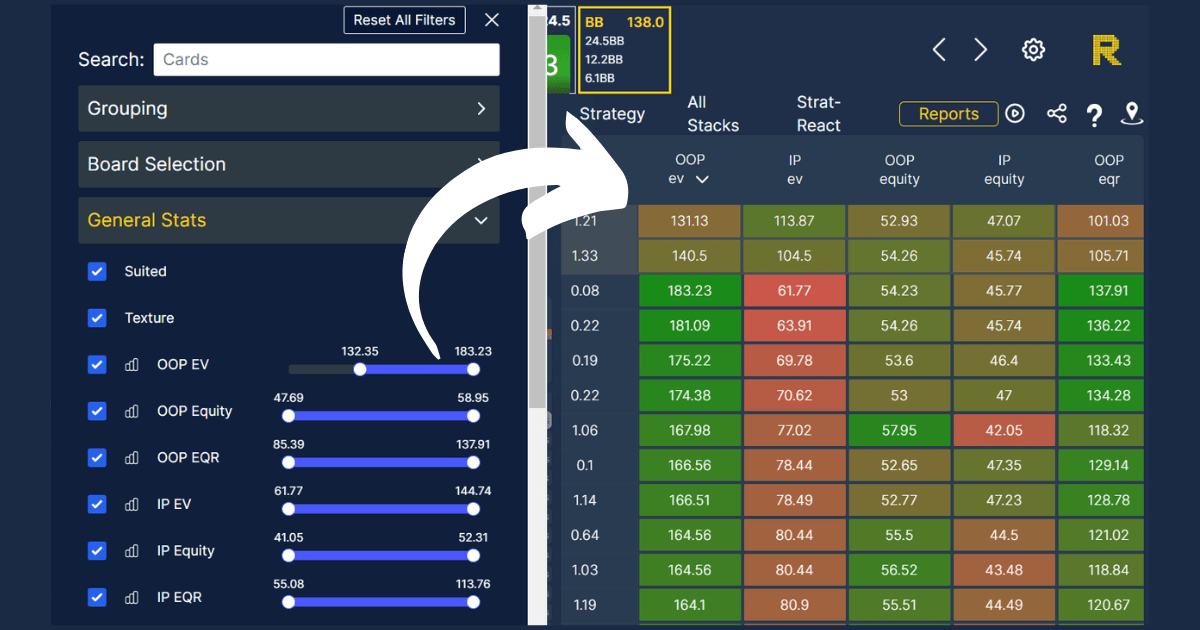
Macro reports are filterable aggregated solver strategy reports and they are available for every postflop spot in the online range viewer.
Aggregated macro reports
You can view the highest & lowest % bet flops, the highest and lowest EQ boards for IP and OOP and filter by board type or cards to see how optimal strategy fits together in the bigger picture. To change the display order click the header of a given column.
While analyzing any postflop spot, click the Reports tab to view macro strategy for all flops at once.
To change the runouts postflop, click on the board card(s) displayed in the game tree navigation bar or on the table. You can change flop, turn and river cards in the pop up window. The strategy for that position in the tree will update automatically.
Ranges and strategy breakdowns
Action ranges
The yellow mini grids show the ranges and weights for the actions of active players in the hand - hover over a hand combo to see its weight. The grids are a useful visual in combination with the main strategy chart view when studying to understand range vs range interactions.
When analyzing postflop hands you can use the mini grids to view the expected value EV, equity EQ or equity realization EQR. To do that, use the dropdown menu in the top right corner of the yellow range grid.
See EV, EQ and EQr of every hand combo in the range
Copy-paste preflop ranges
Click the copy icon to copy the range displayed in the yellow mini grid. You can then paste it into another solver or range viewing app. The range text format is compatible with PioSOLVER syntax.
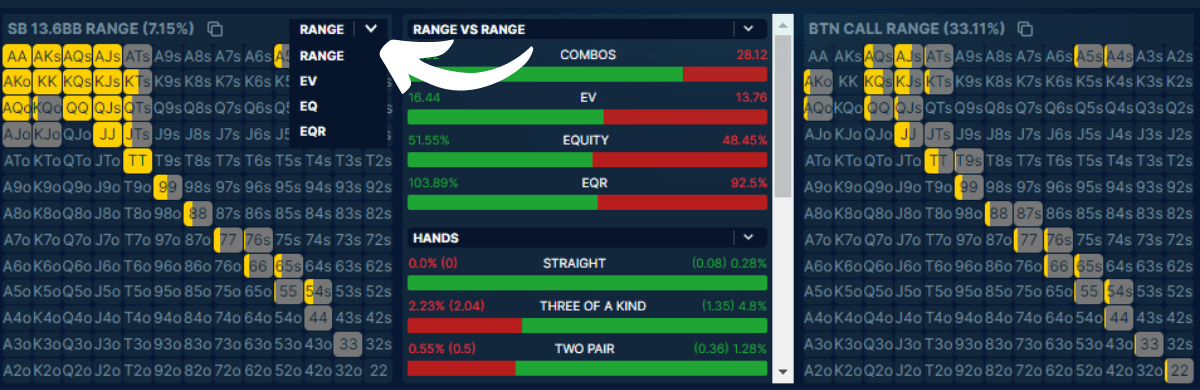
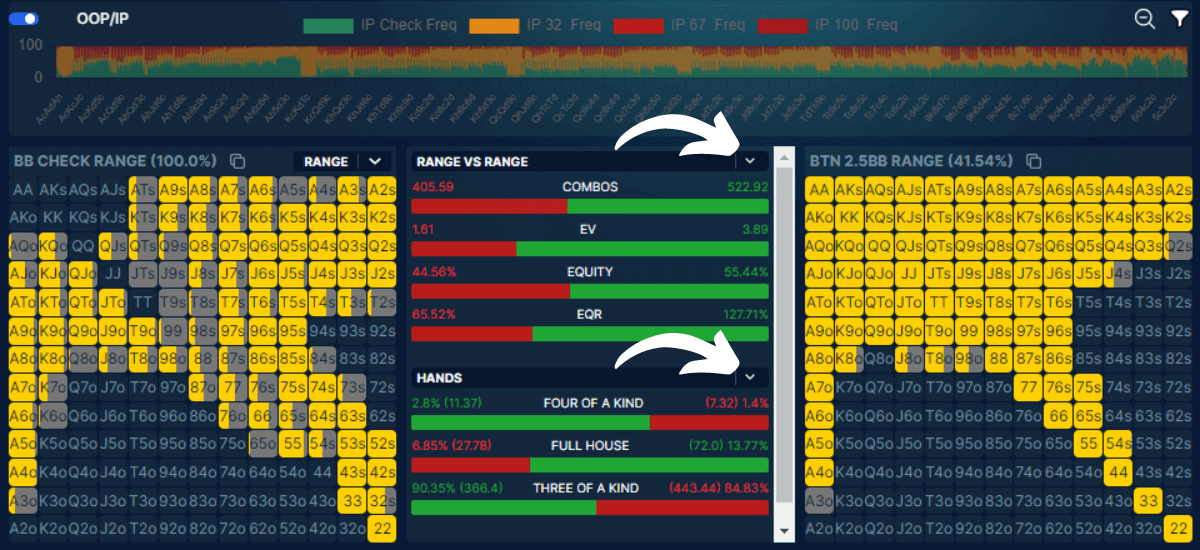
Range breakdown panel
Here you can see a comparison of the range composition for players in the pot, and a breakdown of strategy by hand type for the next player to act.
The numbers at the top show the number of combos for players in the pot.
Use the dropdown menus to switch between range versus range view and the active player’s strategy breakdown.
Range vs Range
When browsing preflop spots, the range vs range feature shows the composition of preflop hand categories for the ranges in the mini grids. You can see whose range has the larger percentage of a given hand type, e.g. premium pairs, suited connectors etc. You can highlight those combos in the mini grids by clicking on one or more hand types.
When browsing postflop (Range Pro subscription), this feature shows a breakdown of range vs range comparison for the players in the pot by different postflop hand categories.For example, you can see who has the larger percentage of nut flushes or top pairs in their range. Clicking on one or more hand categories (e.g. top pair, two pair) on the panel highlights all combos of those categories in the mini grids.
Range vs range hand combos breakdown
Player Range Breakdown
When browsing preflop spots, this feature shows a breakdown of strategy for preflop hand categories for the active player. You can also analyze the composition of the range, i.e. what percentage a certain hand type is in relation to the whole range. For example, vs a UTG raise, MP strategy for premium pairs is to raise 69% and call 31%, and they make up 2.3% of MP's current range. You can highlight one or more hand combo types in the main strategy grid by clicking on or hovering over them in the strategy breakdown panel.
Active player range breakdown
When browsing postflop, the player range breakdown panel shows the active player’s range composition in terms of postflop hand strength grouping. Use the dropdown menu to switch between made hands (e.g. straight flush, full house etc), draws (e.g. combo draw, nut flush draw etc.) and equity groups (e.g top or bottom 25%). The panel also shows the action frequencies for each of those groups, along with the total number of hand combos and percentage of the range a given group makes up. Click on or hover over the listed groups to see them visualized in the strategy chart on the right side.
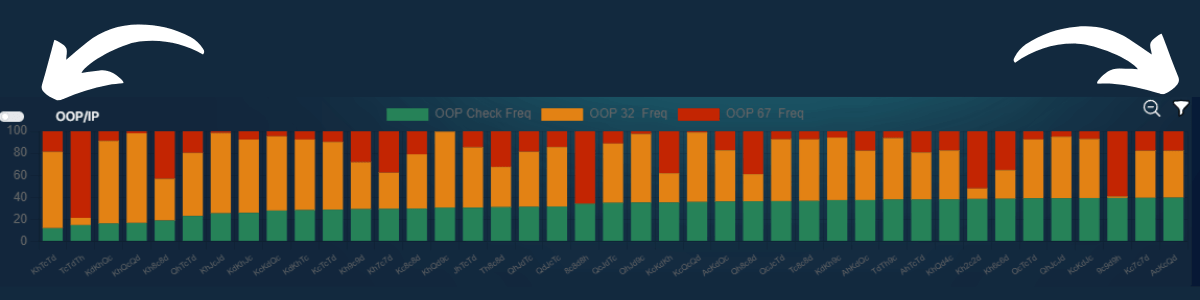
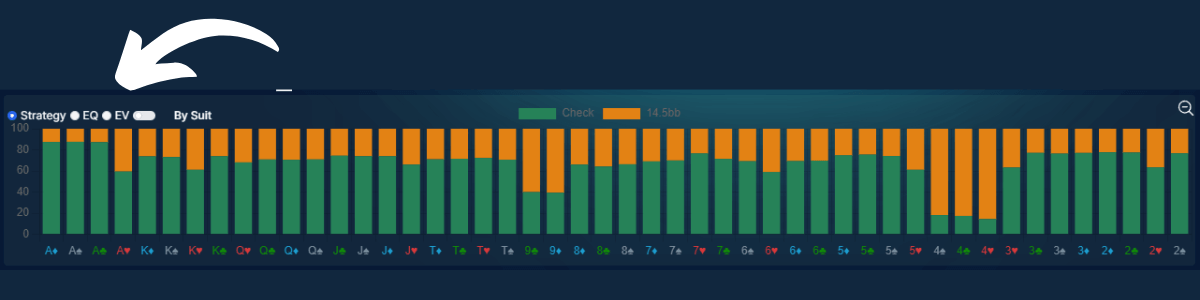
Flop report histogram
Graphical overview of the distribution of strategy across all possible flops. Each bar shows the strategy for a different flop.
Click and drag on the graph to zoom in to a subset of flops. To zoom back out click on the magnifying glass icon.
Hover over a bar to see the exact values, and click to load the strategy for that specific flop in the viewer for more detailed analysis.
Click on actions in the legend above the histogram to show/hide those actions in the graph.
Click the IP/OOP toggle to switch display between OOP flop decision or IP flop decision after OOP check.
Use the flop report histogram in conjunction with the reports and filter features. Sorting or filtering the aggregated reports table updates the graph, giving you a powerful tool for visualizing and discovering GTO trends and gaining macro strategy insights.
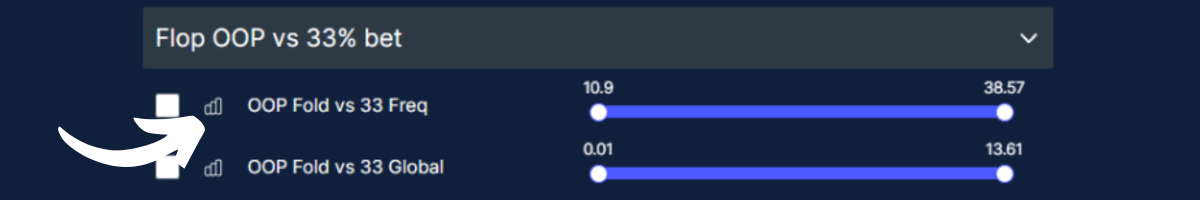
You can filter the histogram by board category, e.g. 2 broadway with ace, low paired, low unpaired etc. or input specific cards in the search field. It's also possible to refine your search using the sliders. To access the filter settings click the filter icon on the right hand side above the histogram.
See the latest updates of the aggregated reports and filters feature. Use the dropdown menu to filter by board category. Each of the available stats has a slider that you can use to show only flops that fall within a range.
Clicking on the bar chart icon next to each stat in the filters menu updates the histogram to include that stat, for example you can display a graph showing OOP x/r % by flop, or IP EV by flop.
You can use multiple sliders and filters together to build compound queries, giving a powerful tool to discover macro strategy insights. e.g. - to find out the highest IP check back flops where OOP cbets below a certain value, move the OOP cbet slider to the left, then sort the table by IP cbet.
Display any stat from the macro reports on the histogram
On turn and river the histogram becomes a poker heat map. It can display strategies, EV or EQ values and it can also be filtered by suit. The heatmap gives you a quick visual overview of action frequencies across all the possible turns or rivers, depending on the current street of action.
Use the By Suit toggle to switch between grouping cards by suit or grouping by rank.
Click and drag on the graph to zoom in to a subset of turns or rivers.
Hover over a bar to see the exact values, and click to load the strategy for that specific turn or river card in the viewer for more detailed analysis.
-------- You can check out all these features for free. Just sign up at rangeconverter.com and claim your free demo.

 .
.