The best way to study post flop strategy with aggregated reports (free poker study worksheet included!)
What are aggregated reports in poker?
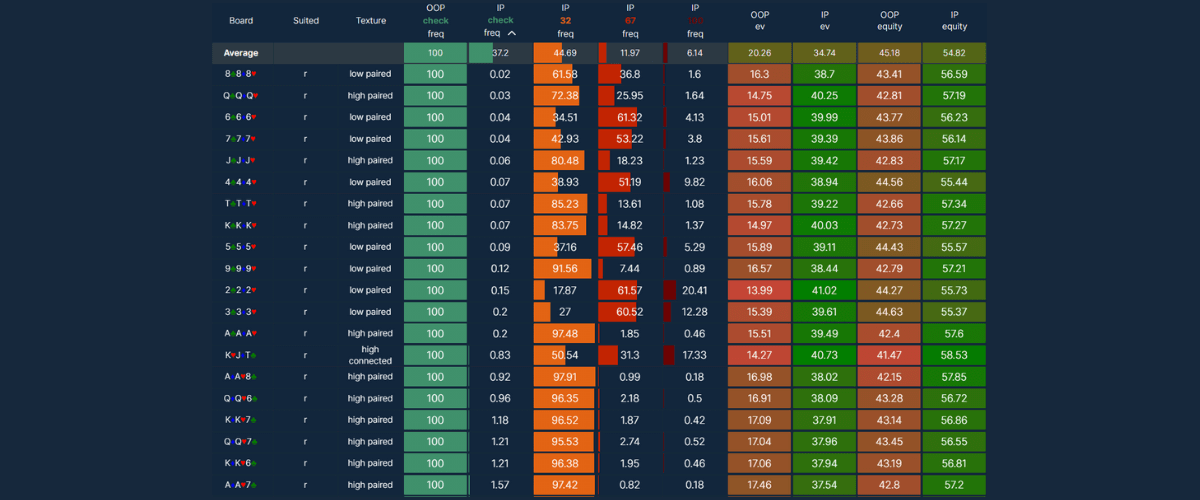
Aggregated Reports are tables or spreadsheets of strategy data for a specific spot, such as Button vs Big Blind in a 3bet pot.
They show an overview of action frequencies and other key information for each player in the hand, across all possible flops, all in one view.
This article explains why you should incorporate reports into your poker study routine, and outlines some methods for how to use them for study and to test your knowledge of post flop strategy.
Why are aggregated reports useful for postflop study?
They also are useful for discovering patterns in GTO strategy, allowing for simplifying strategic decisions to implement in your overall postflop game plan.
Studying aggregated reports is a great place to start when learning postflop strategy.
Before you dive into what you are supposed to do with each combo on every board, it's important to know what the frequencies for the different actions should look like on a macro level.
- Is this a range check spot? - A range bet spot? - What are the best bet sizings to use on this flop?
Learning the frequencies for each flop is still a very difficult task. But there is a better way!
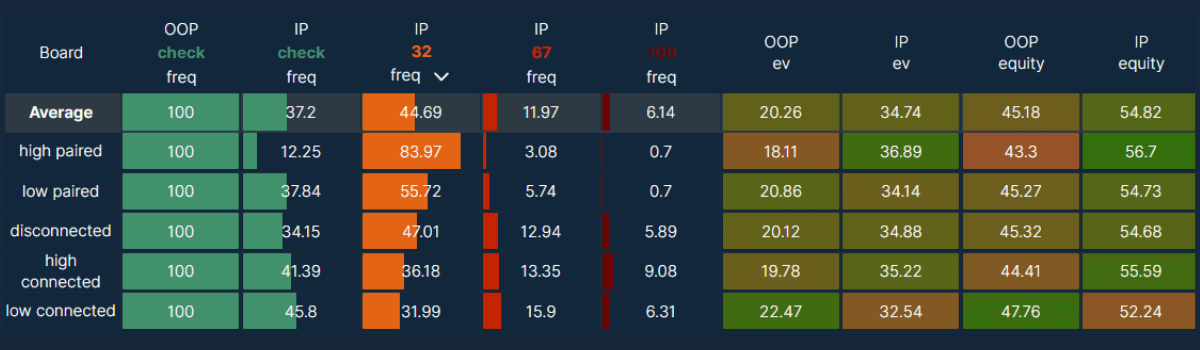
The trick is to start by grouping flops into different subsets.
For example, by high card, flop texture, whether the flop is connected or suited.
This makes studying a spot much more manageable, and makes it much easier to spot patterns in how certain flop types should be played in similar situations.
For example, if you notice that your opponents frequencies are way off in a spot - such as checking or betting too much, folding or raising too little - you can adjust your strategy to take advantage of their likely range imbalances.
The aggregated reports at RangeConverter also come with a selection of filters and controls to customize the table and flop histogram.
This is a powerful tool with the flexibility to answer complex poker queries by building and filtering your own custom reports, then visualize the results in a graph.
You can select what statistics are displayed in the table, including response to a bet, such as check-raise and check-fold frequencies.
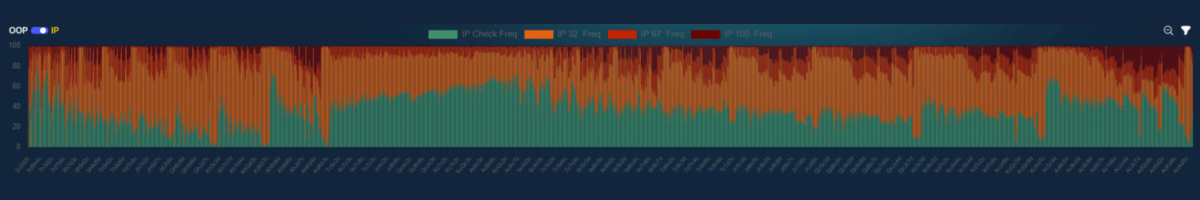
The graph updates automatically to reflect the results in the table, and any statistic can be displayed there.
This is useful to visual learners and can make spotting patterns easier.
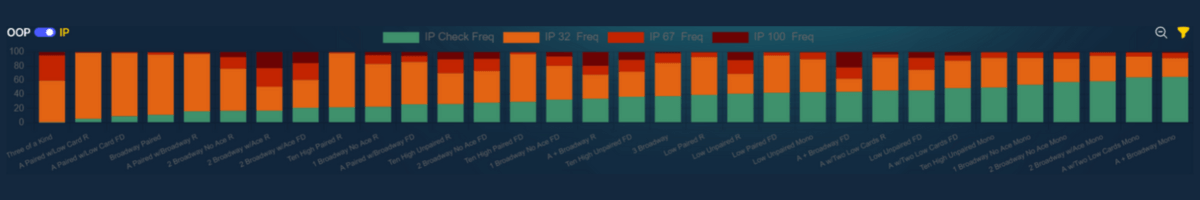
IP strategy on all flops, sorted by suited (rainbow, monotone, flush draw)
Do you know which flops you should be betting, checking or raising most or least often in each spot?
What do these flops have in common?
Aggregated reports give you the answers to these high level GTO poker strategy questions.
Learn patterns, macro trends, and identify outliers.
Discover GTO strategy that you didn't know existed.
Build a solid foundation for postflop strategy and crush the games!
Want to learn GTO strategy using aggregated reports?
Or sign up to Range Pro for the game type of your choice to access preflop, postflop, and reports for every spot:
How to study poker strategy with aggregated reports?
Pick a common spot to study to start with.
Common spots come up more often and so can have a larger impact on your win rate if you play them well.
e.g. - BTN vs BB SRP, SB vs BTN 3BP, SB vs BB SRP etc
Once you have learned the GTO strategy for the common spots, your overall competence and intuition will increase.
The knowledge gained will help you to extrapolate accurately to other less common spots and improve your poker intelligence.
It is recommended to first study the strategy by grouping the flops into related subsets.
This gives an overview much quicker, and makes it much easier to spot patterns of play in flop types.
This is better than trying to remember the strategies by initially looking at all of the flops at once, which can be overwhelming.
Once you’ve got an idea of how different flop types should be played, then it’s time to delve deeper by looking at specific flops.
There are many ways to study with aggregated reports, here is one possible method:1. Study the preflop ranges for the IP and OOP players involved in this spot. This is a crucial first step! 2. Get familiar with the average values for this spot for IP and OOP. The EV and EQ values, bet sizing, bet frequency, fold frequency etc. This will give you a feel for the baseline strategy. 3. Group the flops into subsets (high card, texture, suitedness) and sort by EV and EQ to learn the patterns for which flops are best, worst and average for IP and OOP. 4. Look at which flops are best for IP, which are best for OOP - sort the table by EV and EQ. 5. Apply grouping (high card, texture, suitedness) and sort the table by key stats relevant to the spot to learn the strategic patterns for different flop types. Here are some examples of key stats: - most common bet size
- highest cbet flops
- highest check flops
- highest fold vs bet
- lowest fold vs bet
- highest raised flop
- lowest raised flops
6. Look at which flops have the highest, lowest and average key strategy stats for each spot by sorting the table as in the step above.
At each step, write down the main takeaways for IP and OOP.
What are the highest and lowest value flops or flop types for different strategic actions?
What flops or flop types fall into the average value range for different strategic actions?
Test yourself regularly to cement the knowledge!
How to train your poker skills using aggregated reports?
Once done, you are ready to train your poker skills!
Here are some examples of questions to go through when testing your flop strategy knowledge.
Macro analysis
- highest EV flops for IP?- highest EQ flops for IP? - highest EV flops for OOP? - highest EQ flops for OOP?
- highest cbet frequency flops?- highest check flops frequency? - most common bet size? - which flops bet big most often? - which flops bet small most often? - highest fold vs cbet frequency? - lowest fold vs cbet frequency? - highest raised flops? - lowest raised flops?
Here are a few ideas for different training exercises:
1. For each question, write down the types of flops that you think are the right answer (e.g. Ace high flops, monotone flops, flush draw flops, low connected flops etc.).2. For each question, try to write down a few flops that you think are the right answer. 3. Pick a set of 5-10 flops of different textures. Then go through the Qs, choosing the flops that you think are the right answer for each. -
4. Pick a single flop from a set of flops. For each flop, answer the following: - is the flop above or below the average for EV, EQ, and the action stats for IP and OOP? - what would you estimate the EV, EQ and action stats to be for IP and OOP?
Once you've gone through the questions, check your answers in the reports.
If any are totally wrong, think about why that might be, then study those flops in more detail in the viewer.
Then look up the correct answers from the report and study the relevant flop strategy in more detail in the range viewer.
You don't have to do all the questions every time, just do an amount that you feel comfortable with doing regularly.
The more you do these, the more familiar you'll be with where IP and OOP stand on any given spot, and the optimal strategy expected from each player will come much more naturally to you.
Your "instincts" will become better and faster, freeing up time and mental energy to focus on other strategic considerations for the hand. You will also get closer to the right answer each time, helping prevent making up strategy on the fly mid game and developing bad or exploitable habits.
Summary
Aggregated reports are a powerful tool for simplifying the complex postflop gametree and learning postflop strategy.
We covered a method for studying, a method for training your knowledge, and there’s a worksheet to test your skills.
Unfortunately, there's no substitute for putting the hours in the lab.
This is where edges are gained!
Feel free to ask any questions. Join the RangeConverter community on Discord and get involved in the discussion!


