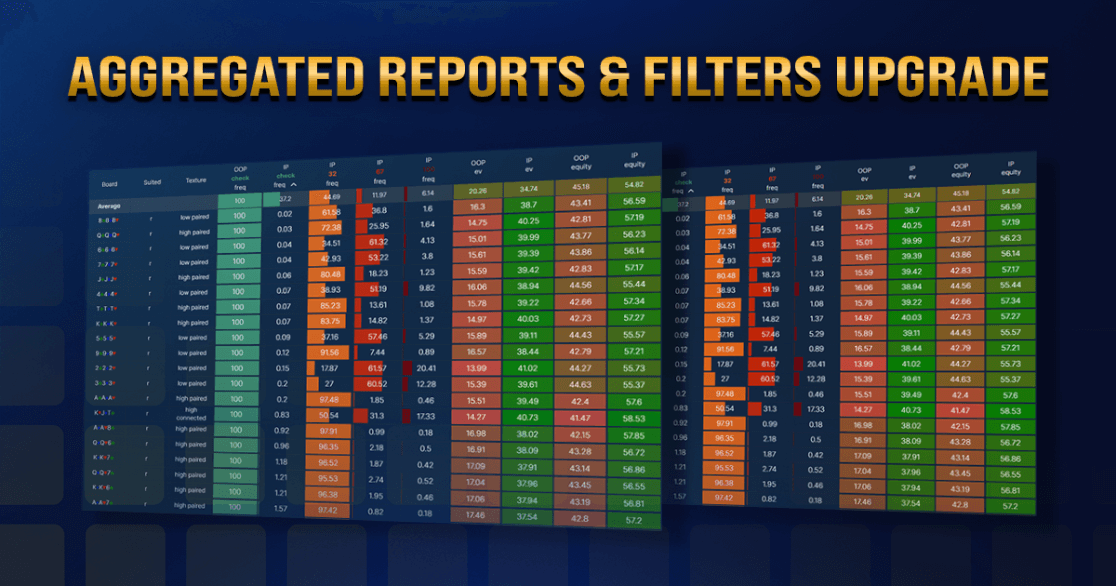
Aggregated Reports & Filters Feature Update
Highlights of the changes in this update:
- UI overhaul - Filters control panel - Average and filtered average rows added - Columns added for flop suitedness and flop texture - Board selection for display in the reports table - Flop grouping by high card, suited, texture and extensive board category - Many new statistics added for IP and OOP. Ability to customize the report for your poker study needs. - Option to display any of the statistics in the flop histogram
Aggregated reports are an essential study aid for both beginners and advanced players.
They are a great place to start when learning postflop strategy as you can see what the frequencies for the different actions should look like for different flops and flop types.
For more advanced players, it's a powerful tool with the flexibility to answer complex poker strategy queries by building and filtering your own custom reports, and visualizing the results in a graph.
As well as gaining new strategy insights, you can use it to simplify your game plan and uncover potential exploits for the player pool in your games. In other words, to play better poker.
 New aggregated reports
How to access the reports?
There are postflop reports for:
UI overhaul
UI overhaul
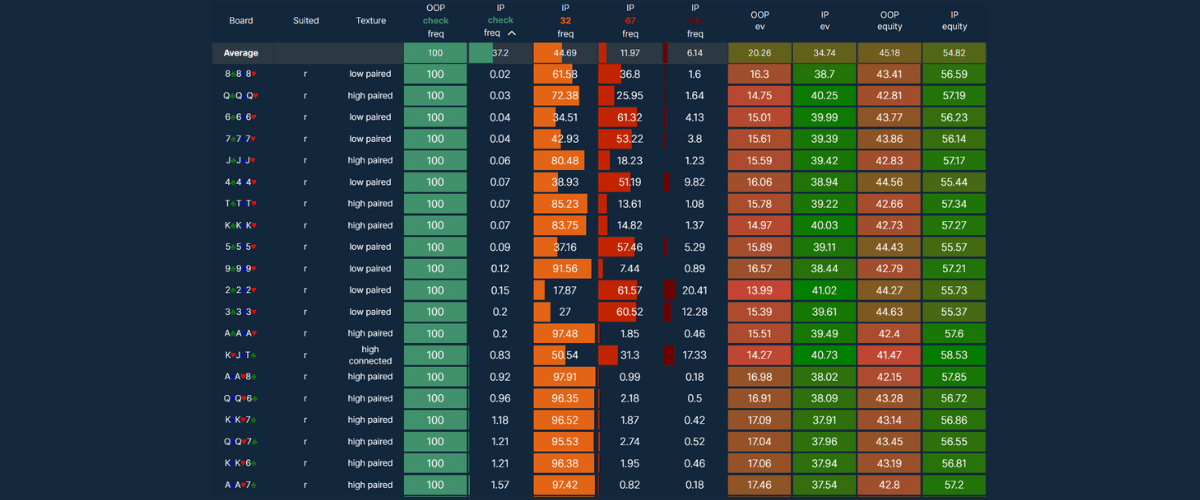
Action frequency stats are now styled differently to the EV, EQ and EQR stats.
Action frequency stats are the same color as in the strategy grid (fold=blue etc.) and instead of colouring in the whole cell, are represented by a bar with width proportional to the frequency %.
This makes the reports more friendly to look at, and much easier to read the table and skim it for information and patterns.
 Aggregated macro strategy reports
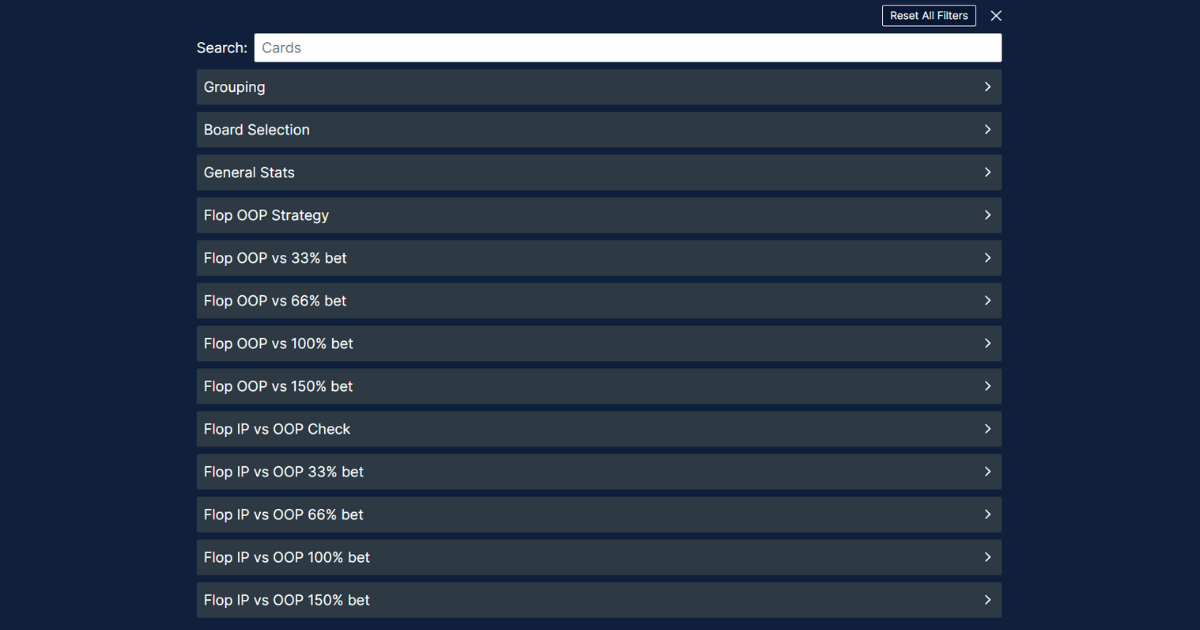 Stats filter categories
If a stat is ticked, it will be visible as a column in the reports table. If unticked, it will be hidden.
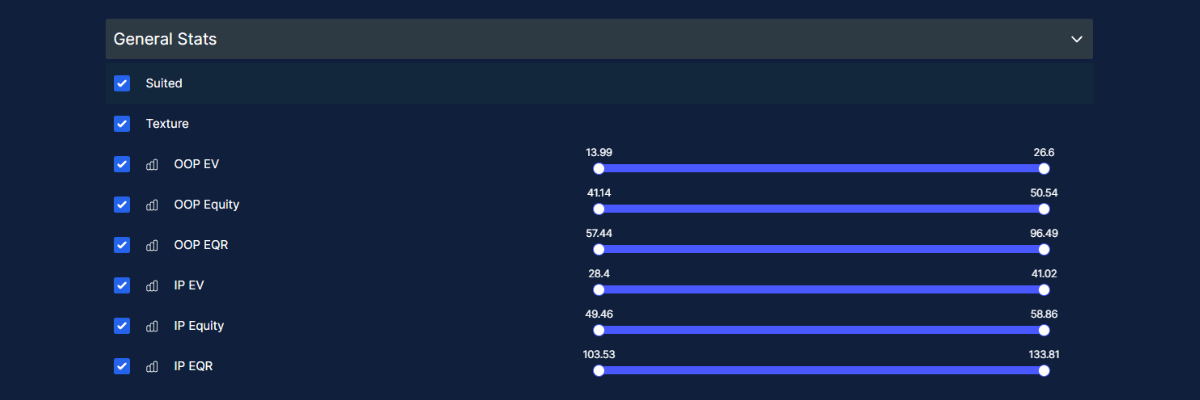 General flop stats
Moving the slider will only show matching flops that fall within the range set by the slider. e.g. flops where cbet is higher than 75%.
Filter sliders still work even for stats not being displayed.
Setting multiple slider filters allows you to build complex compound queries to get answers to poker macro strategy questions of your choosing.
e.g. to find flops where 1/3 pot cbet is higher than 75% AND OOP x/r vs 1/3 pot is higher than 15%
A reset all filters option has been added to return all the values and column visibility back to the default state.
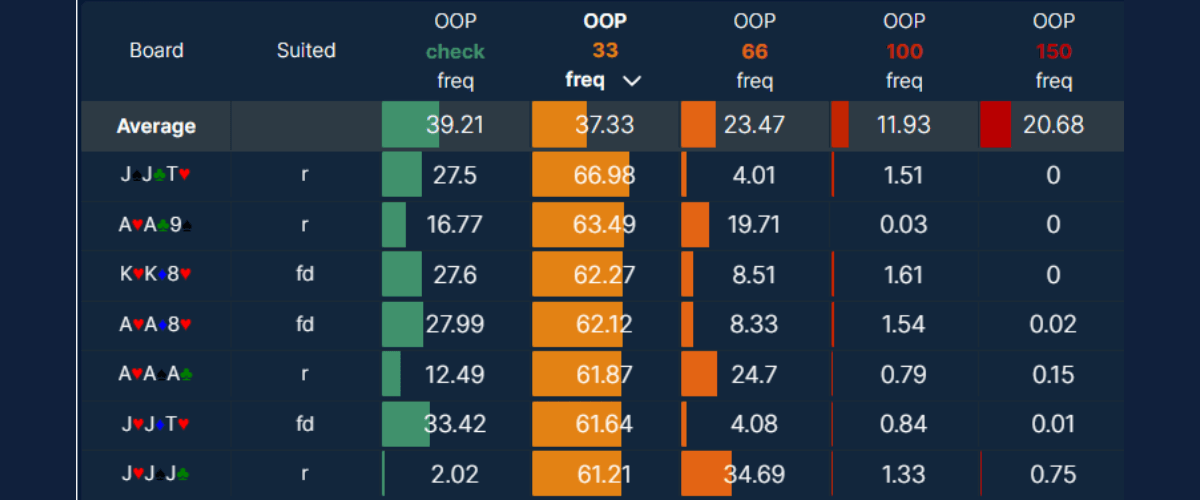
Average values row added for all flops and filtered flops
The top row contains the average value of all (unfiltered) flops. 1755 for NLHE and 573 for short deck.
If filters have been applied, the average values of the filtered flops are shown in the second row.
The number next to the filter icon in the Board column shows the % of flops that pass through the filters.
This allows you to see at a glance what the average play is in a spot, and whether a flop (or set of flops) is higher or lower than average for any stat. For example, lower than average fold, higher than average check raise.
 Average values row added for all flops and filtered flops
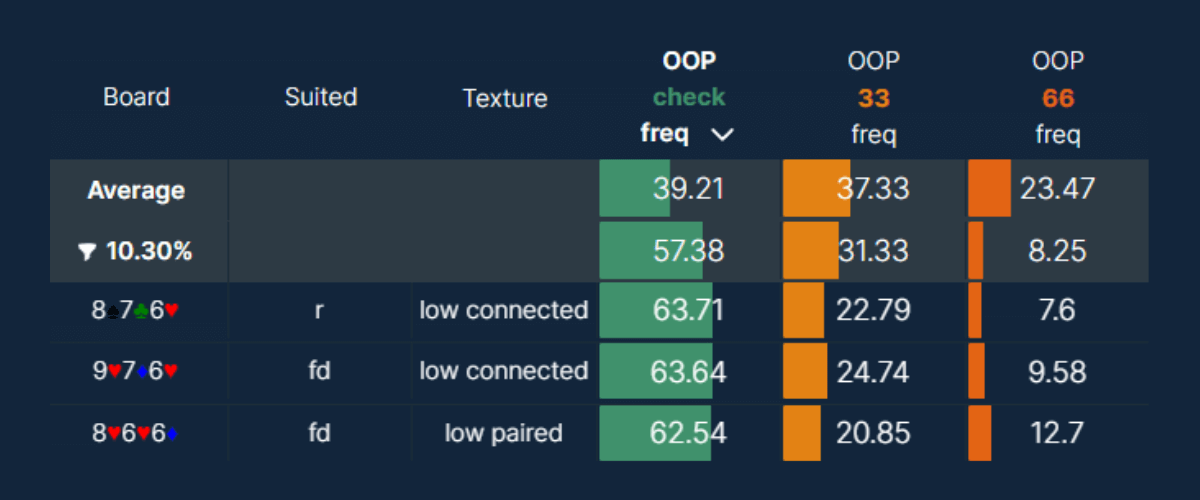
Flops classified by suitedness and texture
For Suited, all flops are one of either:
- r (rainbow = 3 different suits) - fd (flush draw = 2 cards of same suit) - m (monotone = 3 cards of same suit)
For Texture, all flops are one of either:
- high paired (TTx-AAx) - low paired (22x-99x) - high connected (highest card T or more & connected) - low connected (highest card 9 or less & connected) - disconnected (not connected or paired)
 Flops classified by suitedness and texture
To hide them, click the suited or texture checkbox in the General Stats section of the filters.
Board selection
 Board selection filters
There are over 30 categories to choose from, and multiple options can be selected, so you can see strategies specific to the flop types of your choosing.
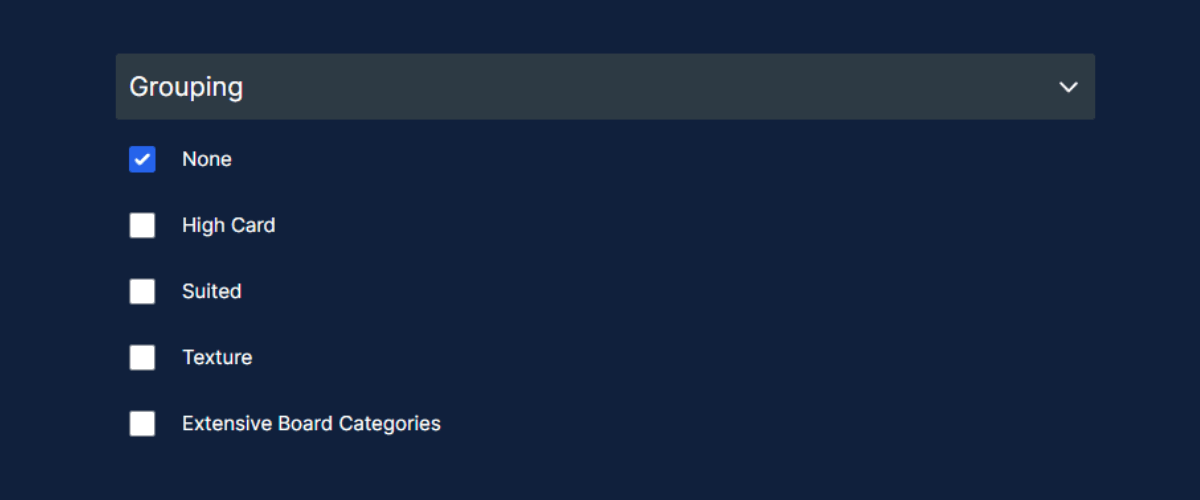
Flop grouping
In the Grouping section of the filters menu, there are options to group flops in the table and histogram by
- - None (default)
- - High card (A,K,Q,J,T,9,8,7,6,5,4,3,2)
- - Suited
- - Texture
- - Extensive Board Categories
 Flop grouping
After making a selection, each row in the table shows the average stats for each item in that category.
For example, grouping by high card shows the average stats for Ace high flops, King high flops, Queen high flops etc. Grouping by suited shows the average strategy for rainbow, flush draw and monotone flops.
The histogram will update to show groupings on the x axis instead of flops.
This is a quick and powerful way to discover high level winning poker strategy takeaways.
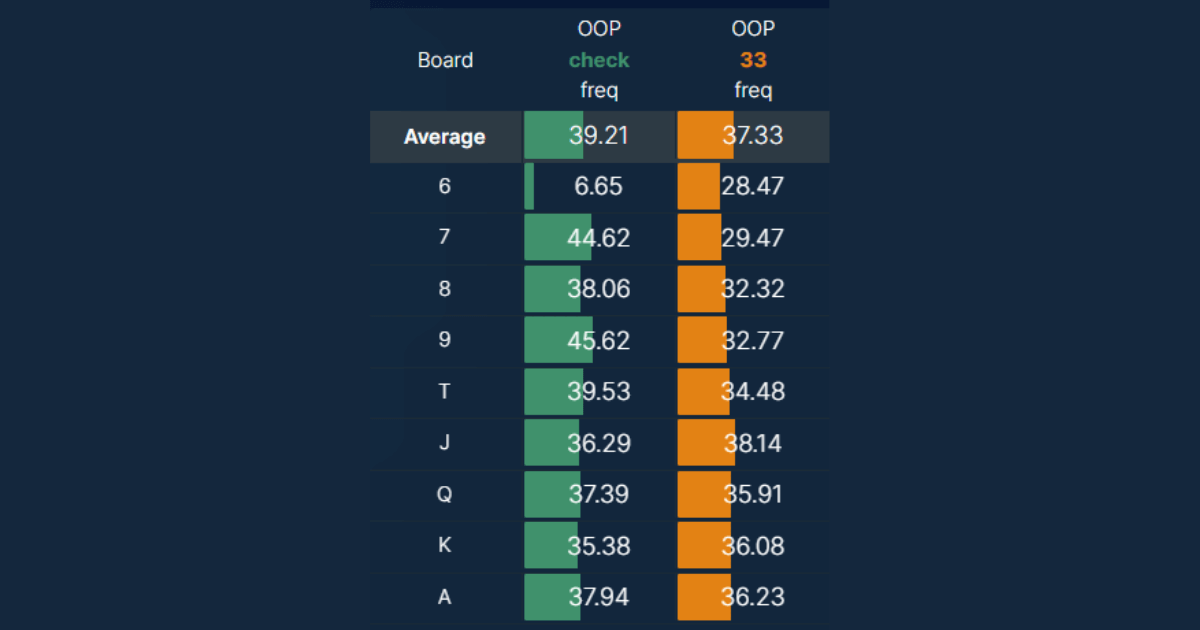 Grouping by high card
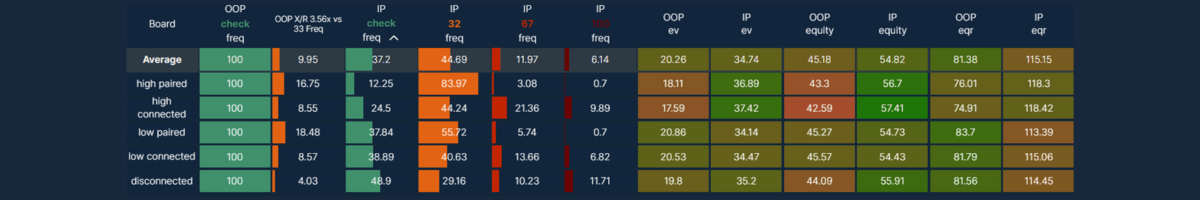 Grouping by flop texture
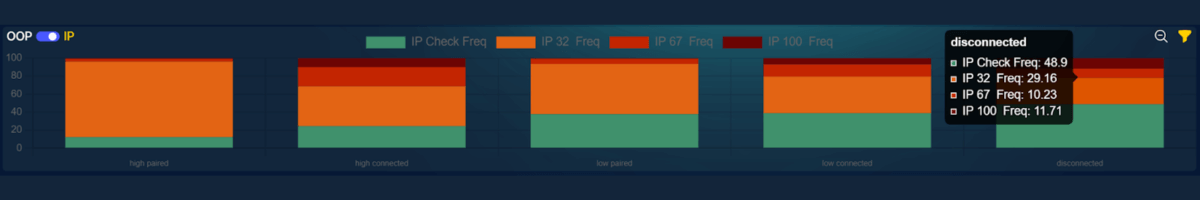 Histogram after grouping by flop texture
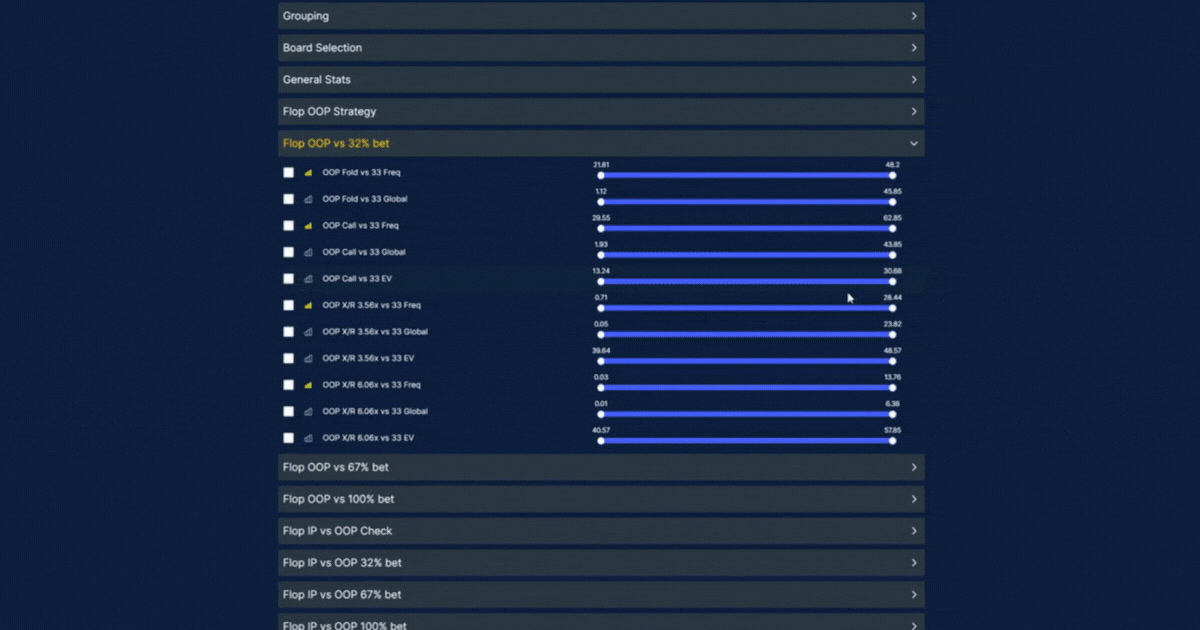
New statistics
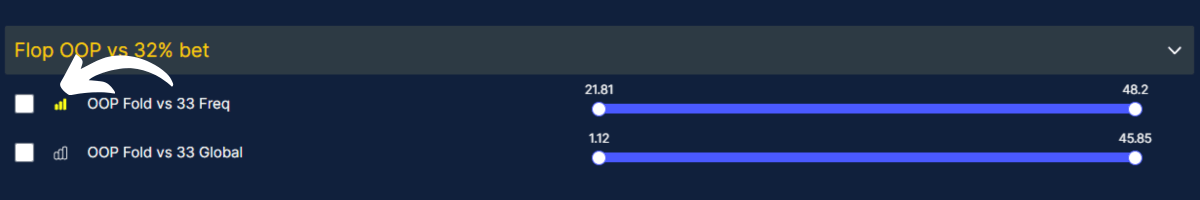
Click the checkbox to add or remove the columns from the reports table, and use the slider for each to filter results.
The addition of all these stats combined with the filtering slider provides the ability to conduct powerful research to gain strategy insights for almost any flop situation you can think of.
Discover new macro patterns in spots to simplify your strategy or exploit opponents who are deviating wildly.
Here's a sample of what's available:
General -
- Suited - Connected - OOP EV - OOP EQ - OOP EQR - IP EV - IP EQ - IP EQR
Flop: OOP Strategy -
- Check - Bet x/y/z%
Flop: OOP vs x/y/z% bet -
- OOP Fold vs x/y/z% bet Freq - OOP Fold vs x/y/z% bet Global - OOP Call vs x/y/z% bet Freq - OOP Call vs x/y/z% bet Global - OOP Check-raise [size] vs x/y/z% bet Freq
Flop: IP vs OOP Check -
- IP Check - IP bet x/y/z% Freq
- Flop: IP vs OOP x/y/z% Bet -
- IP Fold vs x/y/z% bet Freq - IP Fold vs x/y/z% bet Global - IP Call vs x/y/z% bet Freq - IP Call vs x/y/z% bet Global - IP Raise [size] vs x/y/z% bet Freq - IP Raise [size] vs x/y/z% bet Global
For example, how often OOP x/r when IP bets after OOP check.
Global stats show how often a line occurs, taking into account the frequencies of the actions that lead to that spot.
For example, let's say OOP x/r with 50% frequency on a certain flop. But on this flop OOP should only check 10% of the time, and when facing a check IP should only bet 10% of the time.
The x/r frequency is very high at 50%, but the spot hardly ever happens (0.5%).
Compare that to a flop where OOP x/r 15%. This time OOP checks flop 100% and IP bets 100%. In this case the x/r frequency is lower than in the first example, but OOP will get to x/r far more often (15%).
Global stats are useful for seeing how common spots and actions are relative to each other, allowing you to focus study on where it matters most; e.g. to find the most common x/r spot, as well as the flop you should x/r the most on.
 Aggregated reports stats
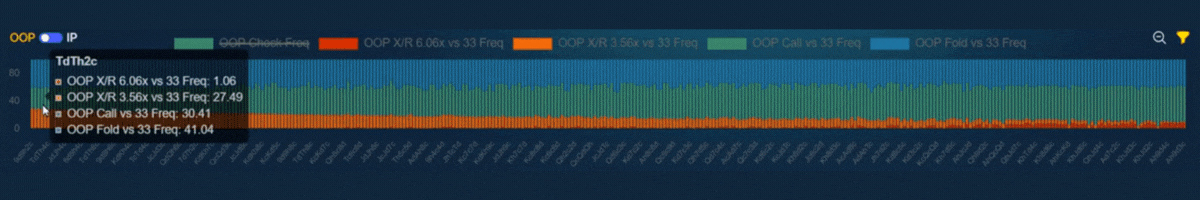
Displaying macro poker strategy stats in the histogram
Clicking on the bar chart icon next to each stat in the filters menu updates the histogram to include that stat.
E.g. - display a graph showing OOP check raise frequency by flop, or IP EV by flop.
Sorting the table by clicking on a column header will update the histogram, so you can show OOP x/r % and organize from highest to lowest x/r value, or by any other sorting of your choice.
Click and drag over the histogram bars to zoom in on an area to get more detail. Click the magnifying glass icon to zoom back out.
Clicking on a bar loads the strategy for that flop in the viewer.
 Click on the bar chart to include the stat and update the histogram
 Aggregated reports histogram
------
Explore advanced 6max 100bb 500z poker strategy using aggregated reports with Range Pro.


